Update from Mixing Up the Tropical Pacific
 Dr. Kelvin Richards, University of Hawaii

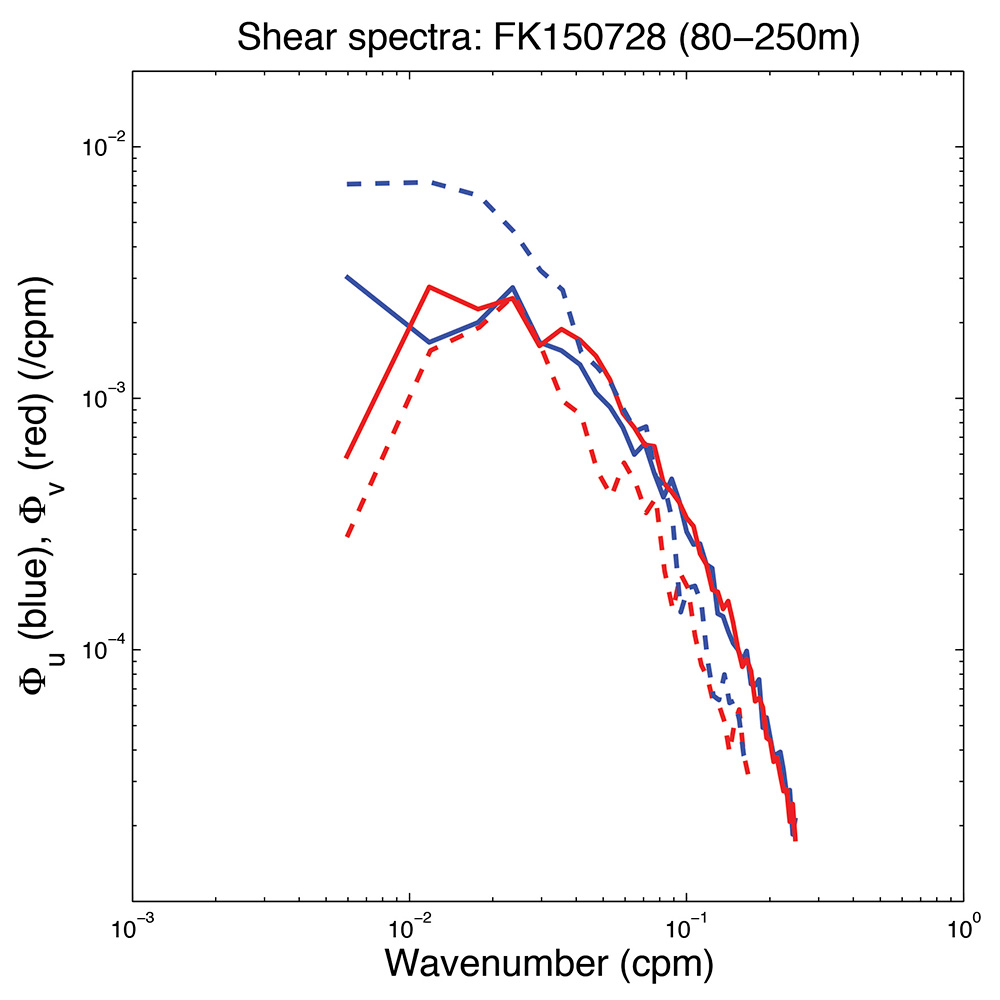
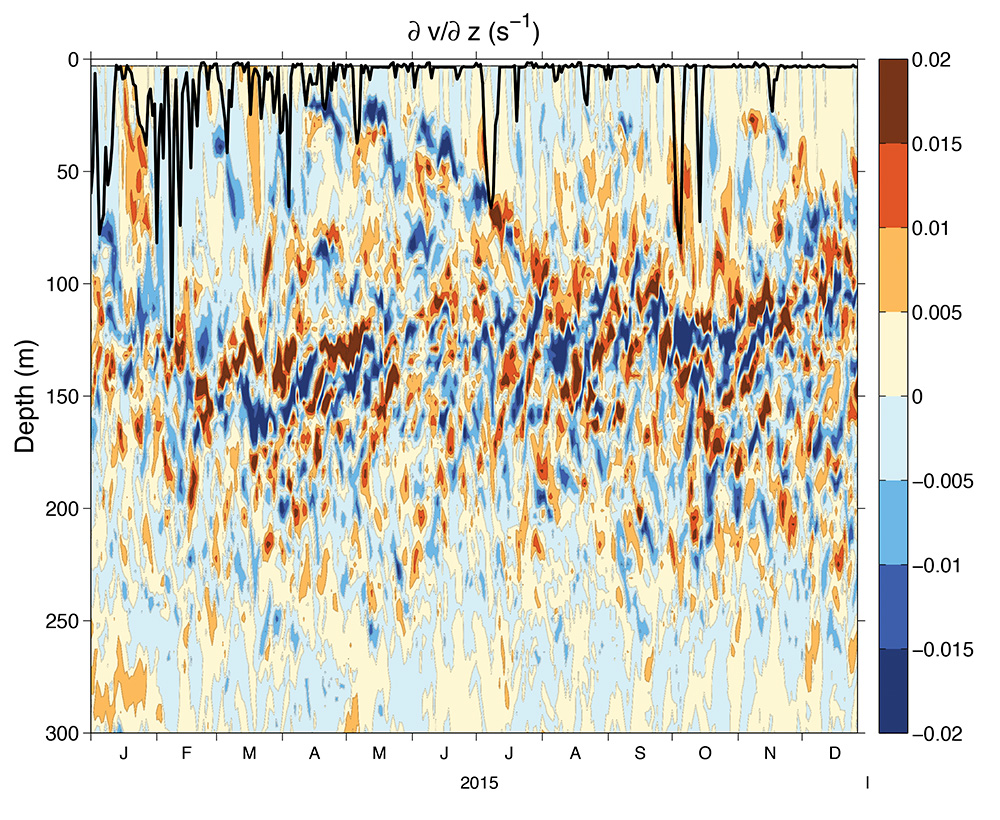
In July 2015, Schmidt Ocean Institute supported an expedition to the central equatorial Pacific to give researchers their first view of the small scale turbulence that occurs in the region. Dr. Richards from the University of Hawaii hypothesized that current climate models may have been missing the important effects of turbulent mixing, and hoped that his work aboard Falkor could contribute to overall improvements in the models and their ability to forecast the size and timing of El Nino Southern Oscillation (ENSO) events. The three-week cruise occurred during strong ENSO conditions, giving the science team a glimpse of the mixing occurring in the region during such conditions.

Once home from the expedition, a high-resolution ocean model of the central equatorial Pacific was run for the three-week period during which the cruise occurred. The model successfully reproduced the characteristics of the small vertical scale flow features observed during the cruise and emphasized that high resolution is needed in both observations and models to accurately capture the relevant structure of this small vertical scale flow. The model is now being used to identify periods of strong turbulent mixing and to put the flow observations into the context of more longterm variations.
Update from Unlocking Tsunami Secrets
 Dr. Satish Singh, Earth Observatory of Singapore, Nanyang Technical University

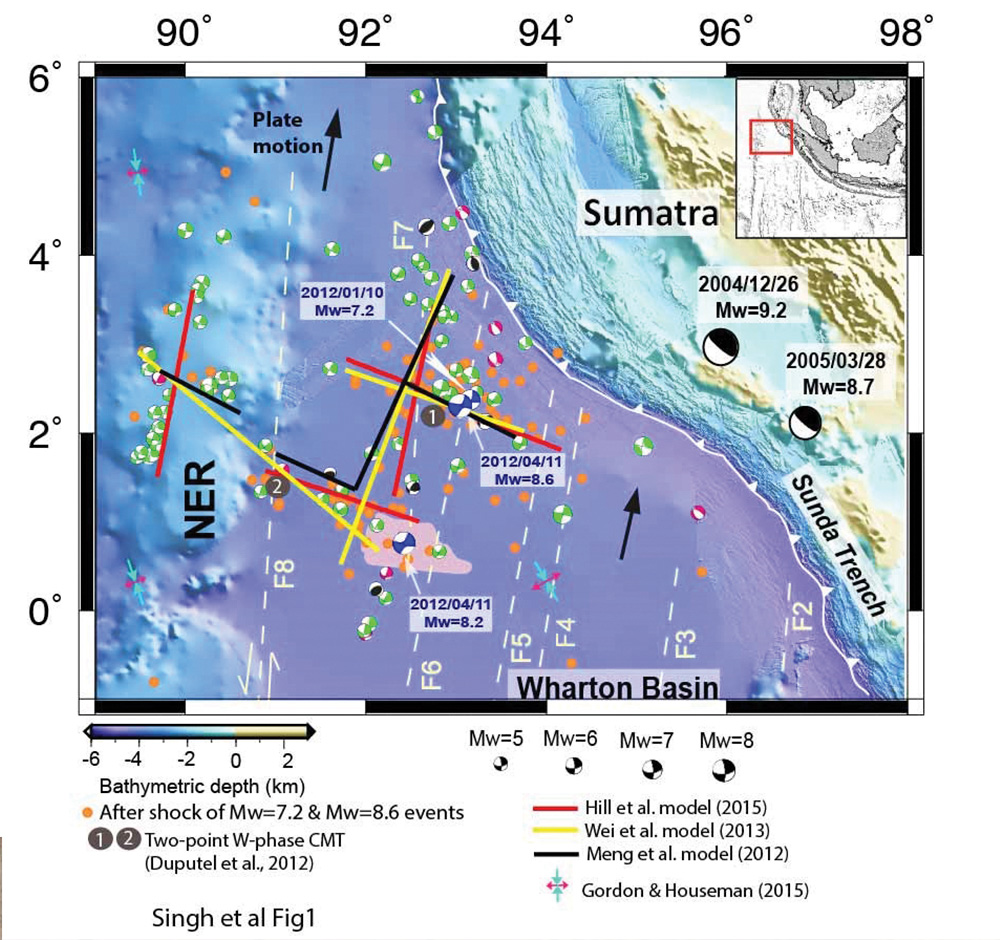
The southwest region of Sumatra, Indonesia, hosts some of the biggest earthquakes in the world. Last year, scientists from the Earth Observatory of Singapore, in partnership with the Institut de Physique du Globe de Paris and the Indonesian Institute of Sciences came aboard Falkor to learn more about what kinds of earthquakes happen in this area and if and when they might cause future tsunamis. The expedition focused on two areas: the Mentawai Gap and the Wharton Basin. The Mentawai Gap is a locked area along the Sunda Megathrust that hasn’t ruptured in 200 years. Experts expect the next great earthquake will happen along this section. Additionally, the Wharton Basin has played host to the largest intraplate earthquakes ever recorded. In 2012, an 8.6-magnitude earthquake and an 8.2-magnitude aftershock ruptured in the Wharton Basin, baffling scientists because most great earthquakes typically happen on plate boundaries, not in a plate’s interior.

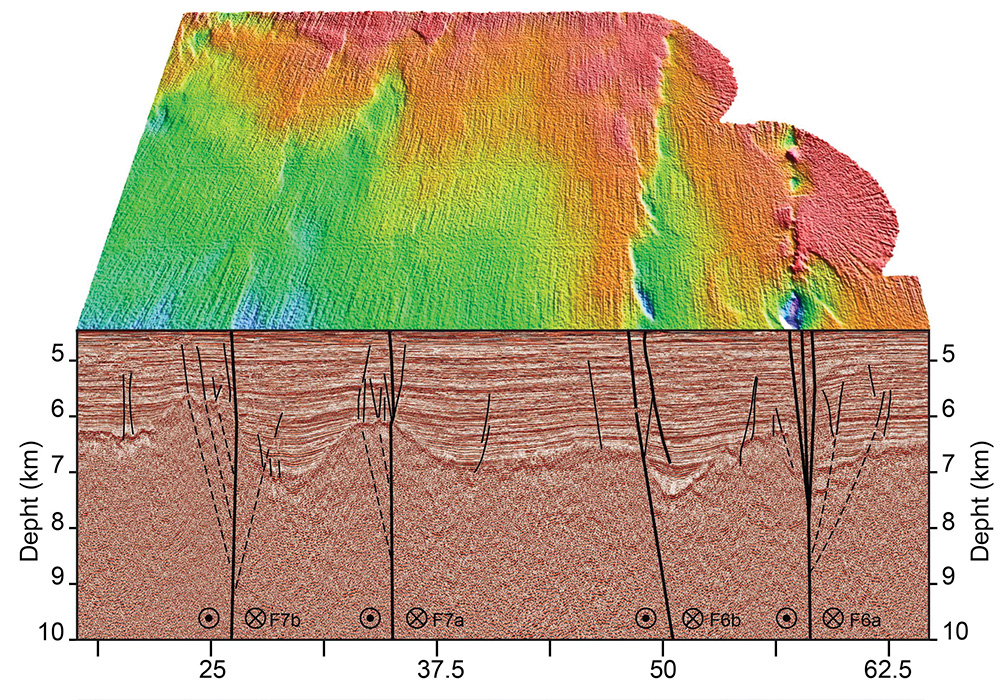
Scientists on board Falkor imaged the Mentawai Gap and Wharton Basin in the highest resolution ever captured for the region. They acquired 17,597 square kilometers of bathymetric data and 2,665 kilometer of seismic reflection profiles. With these data, they are mapping faults on and below the seafloor surface. An upcoming publication will identify the mechanism and faults responsible for the Wharton Basin earthquakes of 2012. Singh and his coauthors found new faults in the Wharton Basin that are perpendicular to the Sunda Megathrust. They propose that these faults occur because different areas of the main thrust are subducting at different rates, creating strain that must be released elsewhere. New findings also suggest that the Wharton Basin may be the site of a future plate boundary between the Indian and Australian plates. These findings will update hazard models and help protect lives across Sumatra and Southeast Asia.
