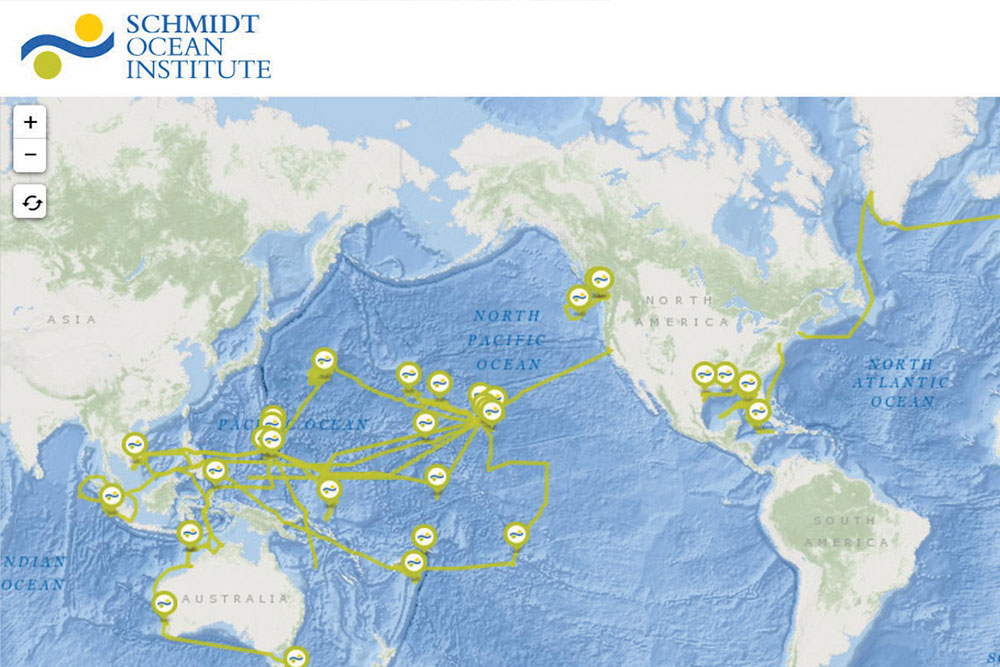
In 2016, Schmidt Ocean Institute enabled users to easily access and understand the data coming from Falkor. Our partnership with Google Cloud Platform allowed us to store all raw data from the ship into the cloud, providing data to collaborators through weblinks.


Utilizing cloud infrastructure decreases maintenance costs of at-risk storage devices that will reach their life expectancy within a few years. Additionally, the Falkor Status Page received upgrades this year, including updated cruise maps and data visualization improvements. We continue to better data stewardship with new developments underway for 2017; this includes plans to build an ROV SuBastian Status Page with similar logging and archiving capabilities as our current Falkor page. This information will provide further insight into the conditions being experienced at sea and where the ROV is operating.
With each of Falkor’s exciting expeditions comes an abundance of data ripe for analysis, visualization, and ultimately, discovery. Using the tools on board, many of the scientists were better equipped to work with their data while at sea, creating visualization tools, maps, and processing infraspectral data, below are some examples.
During the Virtual Vent cruise, Dr. Tom Kwasnitchka conducted a microbathymetrical survey of the Niua South hydrothermal vent field in the Lau Basin. The numerous high definition images are being used to create a digital model of the vents that can be explored using virtual reality tools. The extremely high resolution data collected from ROPOS with specialized cameras created a full-color textured, 5 centimeter resolution photogrammetrical 3D model. The model incorporated an outstanding amount of data, which formed the basis for high detailed geological and biological studies resulting in 3D maps of the entire field. The first attempt at creating a photogrammetic model was conducted on board Falkor during the cruise and can be viewed on YouTube (video embedded below). Additionally, based on the experiences of this cruise Dr. Kwasnitchka provided a white paper to the German Federal Ministry of Research and Education on the possibility of using telepresence on their fleet.
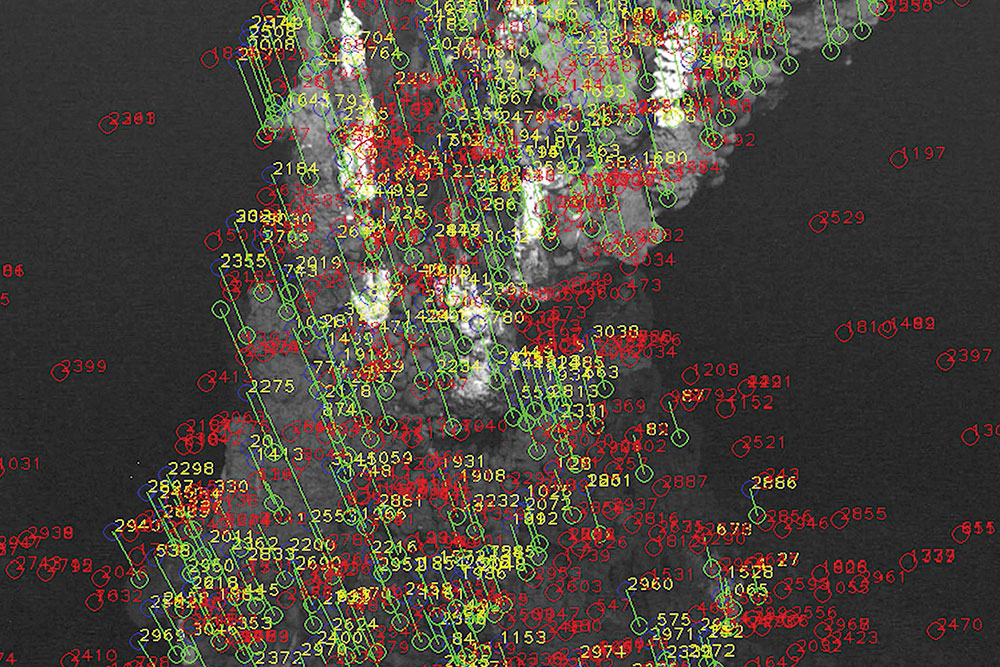
The following cruise in the same region of the Lau Basin, also collected imagery with the goal of creating high resolution 2D and 3D photomosiacs. Dr. Charles Fisher and his team collaborated with Dr. Oscar Pizarro, who had conducted photomosiacing of imagery collected onboard Falkor in 2015, to help with the data processing. Dr. Pizarro developed customized computer software for the reconstruction of 2D and 3D models of the underwater environments from image data. The software incorporates navigation data, sensor logs, and seafloor images for input into the model’s reconstruction algorithms and produces digital models of underwater environments in the form of 3D textured meshes and 2D orthographic seafloor mosiacs. Dr. Pizarro will also deliver technical documentation of the structure and workflow of the photomosiacing software to enable future use by others and provide online access to the data and annotation tools.
During Falkor‘s transit from Australia to Guam, a variety of forward-thinking technology was used to conduct a holistic study of the sea surface. High endurance marine aerial vehicles were used by the interdisciplinary team for the first time to collect large amounts of data about the air-sea boundary. Falkor’s high performance computing was heavily utilized during this cruise for onboard data processing.
